Efficient animal
- Daily production 67.0 lbs
- Daily feed consumed 42.7 lbs
- Feed conversion ratio 1.57 lbs milk / lb feed
- Rumen efficiency 10.4 g CH₄ / kg milk
- C-Lock score 77 / 100

Feed accounts for up to 70% of a livestock producer's total operating cost — yet most operations have no way to know which individual animals are converting that feed into profit and which ones are burning it.
C-Lock changes that. By measuring feed efficiency at the individual animal level, we give you the data to breed better, feed smarter, and cull with confidence.
Avg. percentage of operating cost allocated toward feed
Range in feed efficiency between most and least feed efficient animal in a pen.
15 extra pounds of feed per day for essentially the same production. That's $869 per year, per animal — $2,348 over her lifetime. Multiply that across your bottom quartile and the number gets uncomfortable fast. On a 1,000-animal operation, the gap between your top and bottom 25% is $468,000 every single year.

What C-Lock Delivers

Not last month. Not at the end of the season. Today — with a specific dollar amount attached to each animal. No other tool delivers this at the individual animal level in real time.
Dry her off. Call the vet. Watch her. Cull her. The action is built into the measurement — based on their specific data, not a calendar or a herd average. No interpretation required.
Milk. Muscle. Fat. Heat. Every competitor tells you what you fed. Only C-Lock tells you what each animal did with it — physically impossible to measure any other way.
Your banker. Your packer. Your nutritionist. Measured, auditable, peer-reviewed — not a model, not an estimate. The same measurement that tracks daily profit also produces defensible emissions data.
Your Operation. Your Numbers.
The four solutions above apply to every producer. Below is specific to your operation.
Every cow in your herd has a feed bill and a milk check. Some cover theirs. Some don't. Your herd average can't tell you which is which. Flux can.
Daily break-even per cow — IOFC Milk revenue minus CO₂-estimated feed cost. Recalculates instantly when milk prices change. Negative IOFC = losing money that day. We help you know your herd inside and out.
Dry-off timing driven by data, not a calendar A calendar treats every cow the same. C-Lock flags the specific day she crosses below break-even level, on average 40 days before the calendar would act.
Health flag before clinical signs appear Milk drops before intake during health events. A mid-lactation cow below 65% of expected ECM gets a Health Check flag — not a dry-off order.
Robot integration — automated at scale 55,000–75,000 visits per robot per year. Every visit scored. Every cow tracked. Daily report in your inbox every morning.
Two steers side by side. One is building muscle. The other is burning your feed as heat and fat you didn't intend to put there yet. Your pen average can't see it. Flux can.
CGI ranking — cost of gain per animal Every animal in your contemporary group ranked by actual cost of gain. Not pen averages. Individual animals. The spread between top and bottom quartile is your opportunity.
Lipogenesis detection - 30 - 60 days early. When an animal's metabolic signal crosses into fat-building territory, C-Lock flags it. That happens 30–60 days before backfat is visible by ultrasound or eye.
Individual finish timing — pull the right animal 100+ days separates your most and least efficient animals in the same contemporary group. Stop guessing which one is ready. Measure it.
Efficiency drives profitability Identifying your most efficient animals provides value down the chain. Feed savings. Breeding decisions. Marketing value. Ration evaluation. Measuring efficiency drives it all.
Accuracy vs. gold-standard Respiration Chambers.
McGinn et al., 2021
Bulls · matched gas and carcass data - p < 0.000001
Nichols Angus dataset
QuickFlux correlation with GreenFeed for efficiency scoring
C-Lock validation study
Beef animals · 5 breeds · 3 operations · 3 years
Commercial validation dataset
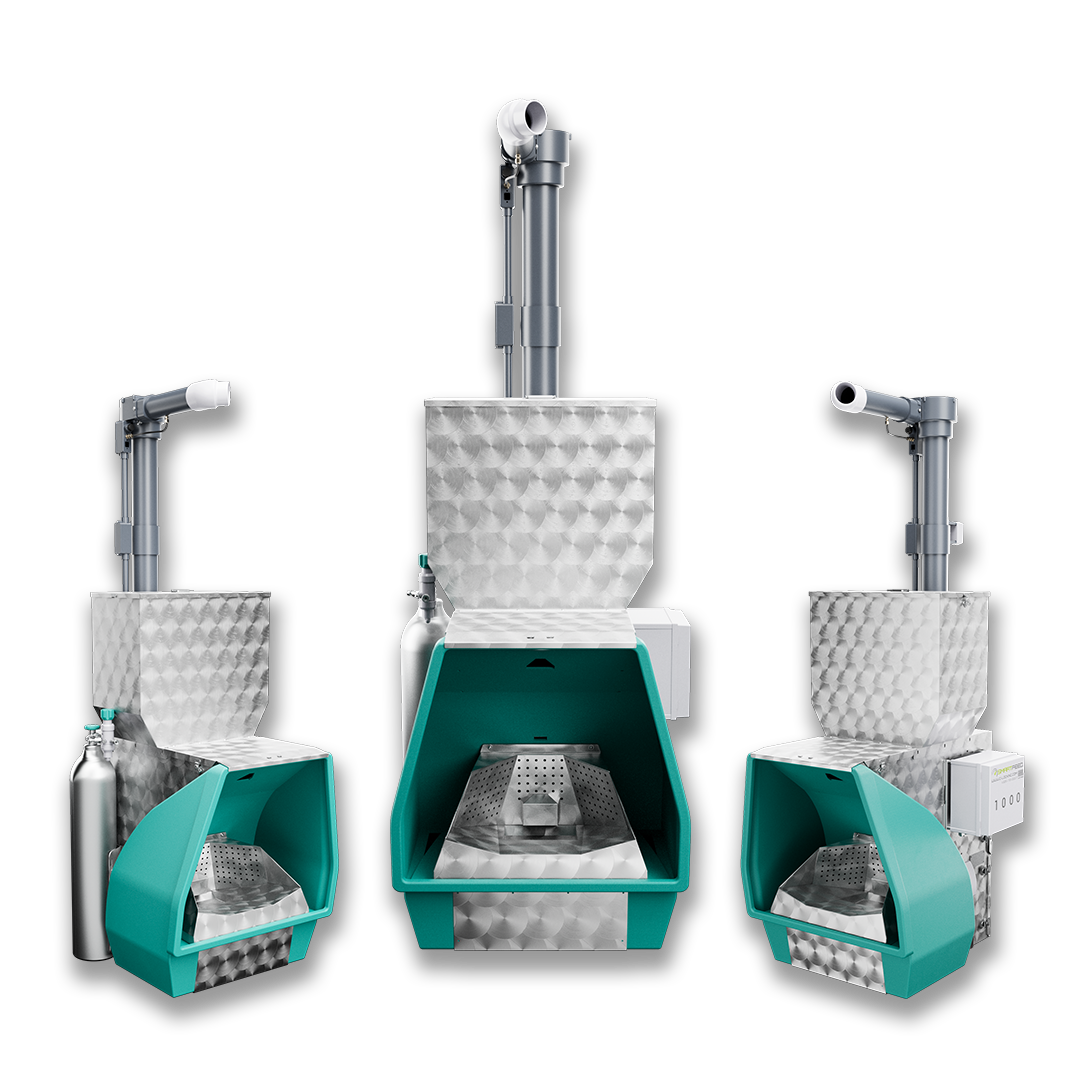
C-Lock’s emissions monitoring solutions are designed to accurately measure and analyze enteric methane and other emissions from livestock. Our GreenFeed system measures the following emissions from ruminant animals:
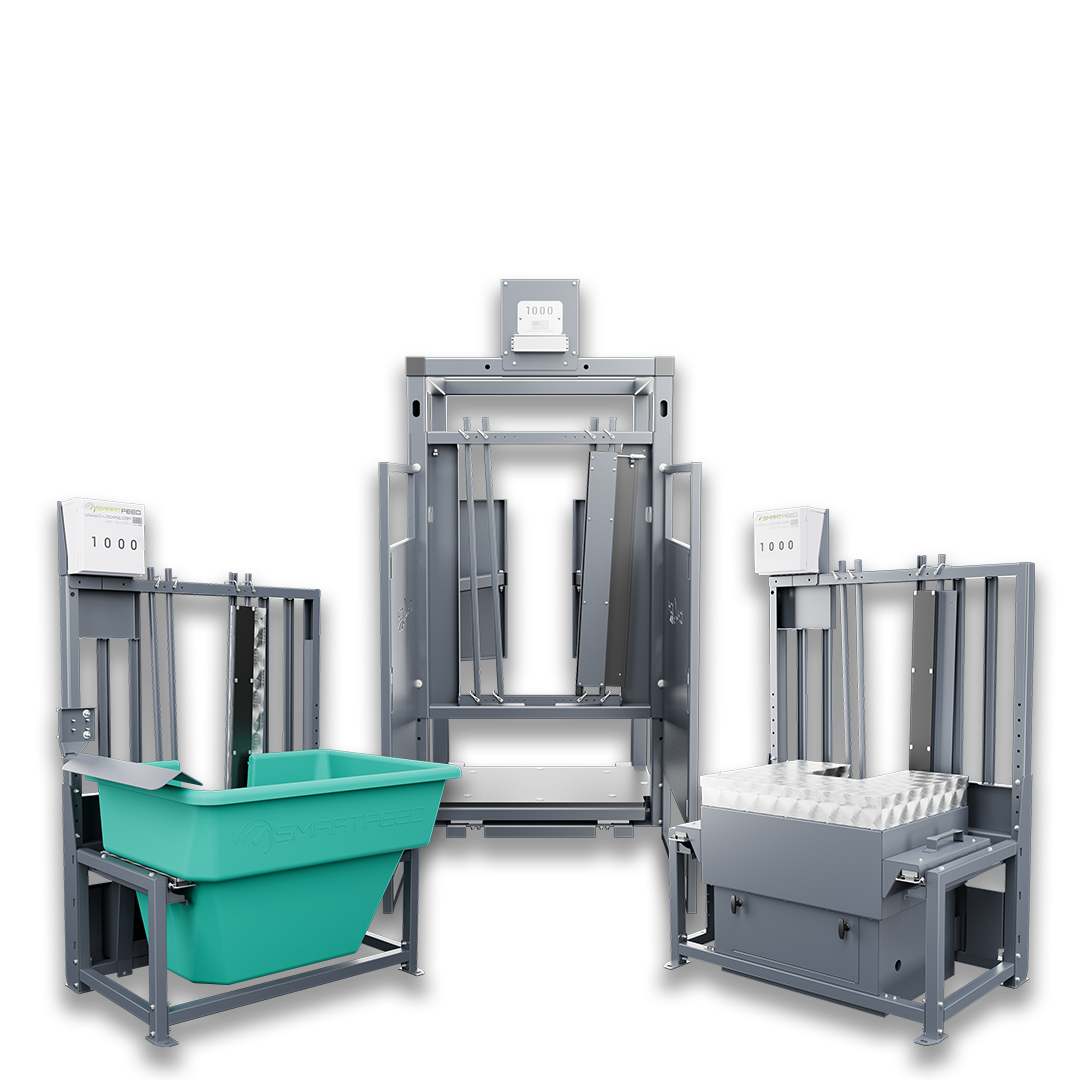
Our performance monitoring solutions are designed to deliver precise, individual animal data to better understand intake behavior, growth, and overall efficiency.Our SmartLine systems work together to continuously measure feed intake, water consumption, and body weight at the individual animal level.
Every claim C-Lock makes is grounded in established animal physiology — confirmed by independent researchers, validated against gold-standard lab measurements, and reviewed by named scientists. We are applying proven science with new hardware precision. Not asking you to trust us. Asking you to look up the citations.
CO₂ as feed intake proxy — validated at 580–680 g CO₂ per kg DMI for Holstein cattle on TMR diets.
Kjeldsen et al., 2024
5-day moving average trigger — PLF industry standard for reducing false positives in animal alerts.
Rutten et al., 2013
Concentration sensors explain 9% of intake variation — published by independent researchers, not a C-Lock claim.
Huhtanen et al., 2015 · R² = 0.09
Milk drops before intake during health events — basis for C-Lock mid-lactation health flag at DIM 120–249.
Poppe et al., 2020
Brouwer heat production equation — established 1965 calorimetry. Used in every C-Lock metabolic efficiency calculation.
Brouwer, 1965
Speak with a C-Lock representative and we’ll show what flux measurements look like on your operation - your animals, your feed cost, your numbers.